


SimuCell Documentation
SimuCell is an open-source framework for specifying and rendering realistic microscopy images containing diverse cell phenotypes, heterogeneous populations, and microenvironmental effects.
SimuCell can generate heterogeneous cellular populations composed of diverse cell types. Each cell type (i.e. subpopulation) can be defined independently by specifying models for cell and organelle shape, and distributions of markers over these shapes. Models are typically algorithmic, but there is support for rendering produced by other tools, such as the highly realistic models learned from image data by CellOrganizer (via the new SLML markup language).
SimuCell allows users to specify interdependencies among biomarker-, cell-, and population-level phenotypes. For example, a marker’s cellular distribution can be affected by the cell’s microenvironment or the localization pattern of another marker. These definable image properties are accessible to users either via a novel scripting syntax built on top of MATLAB, or through the graphical user interface, while intermediate results can define further “ground truths” (e.g. cell boundaries can be used to validate segmentation algorithms).
SimuCell was designed to be easily extensible, providing a standard framework for defining new plugins. Users interested in adding novel phenotypes to SimuCell’s palette can typically do so by writing just a few lines of code, in part due to MATLAB’s extensive library of functions.
Taken together, SimuCell allows the definition of a broad range of phenotypes, encompassing highly non-trivial population-level effects such as cell-type heterogeneity or local cell-density effects.
To produce an image, SimuCell requires you to define several elements:
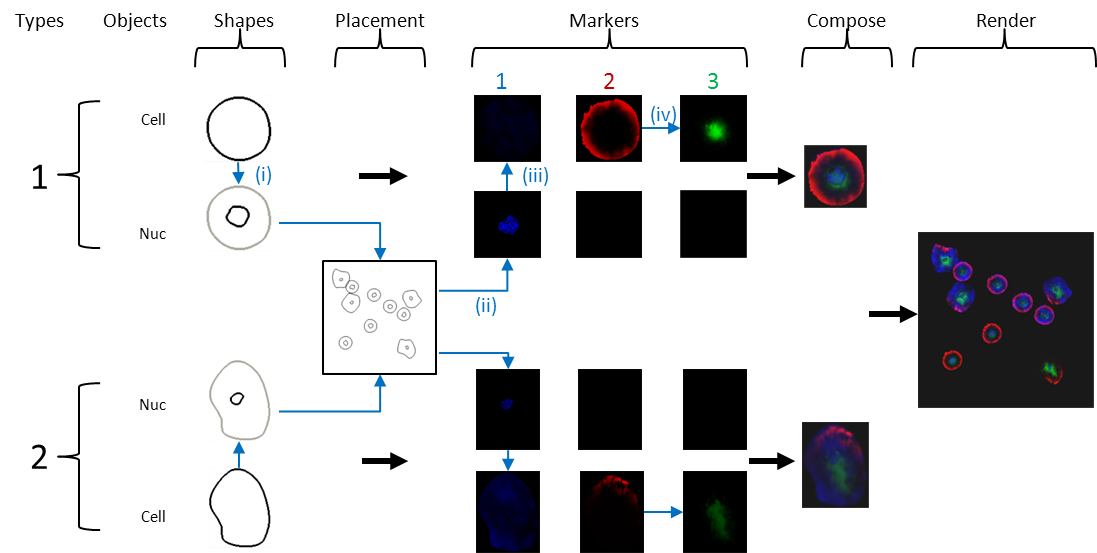
Figure 1 - SimuCell layout process (Blue arrows and images indicate interdependencies for specific example: (i) nuclear shape depends on cell shape; (ii-iii) cell microenvironment (number of nearby cells) affects marker 1 distribution; and (iv) marker 3 distribution depends on marker 2’s distribution. Subpopulations
SimuCell allows you to define multiple cell types (each termed a subpopulation) and specify the fractions of cells belonging to the different subpopulation per image. As shown in Figure 1, for each subpopulation, you will have to define objects/shape, markers and so on.
Objects/shapes are basically the cell components you want to draw in your images. Examples of objects include cytoplasm, nucleus, lipid droplet, nuclear body. Each object in a cell is described, and subsequently rendered, using its own model (i.e. the appropriate plugin). You are required to choose the appropriate plugin for your object, and set the correct model parameters (default values are a good starting point).
Each object is rendered independently, so there needs to be some way to connect the different objects in a cell to place them close to each other. This connection is done by choosing appropriate models (models allow one object to depend on another). For example, to ensure that the nucleus is inside the cytoplasm you could pick a nucleus model that places it inside an already defined cytoplasm. Alternately, you could pick a nucleus model that draws nuclei independently, but then you need to define a cytoplasmic model that draws the cytoplasm around the nucleus.
In this basic tutorial, you will see that the model Elliptical cytoplasm is used to define the cytoplasm and by pointing the model parameter (Centered Around) to the nucleus you can connect the two objects nucleus and cytoplasm.
Thus, there are two kinds of shape models: ones that don’t depend on other objects/shapes (these anchor the cell) and models that depends on other shapes (these will effectively draw the other shapes around the anchor). For any subpopulation, you will have one (and only one) model of the first kind, while all the other models must be depend on each other in some way.
Next, you need to define the markers. First you add/declare the markers that you want rendered in the image. Then SimuCell requires independent definition of markers (in terms of how they will be rendered) for each defined object of each subpopulation giving a relationship matrix between objects/shapes and markers like the following one:
|
Marker 1 |
Marker 2 |
Marker 3 |
|
|
Nucleus |
|
- |
- |
|
Cytoplasm |
- |
|
|
As you can see, all the markers have to be defined by object, although you don’t need to define all the pair object/marker (in our example, Marker 1 is present only in the nucleus and not in the cytoplasm rather than Marker 2 and 3 are only present in the cytoplasm).
In contrast to shape each marker-object pair is defined using a sequence of elementary operations. There are basically two kinds of operation:
Here is a quick summary of the marker plugin operations currently available by default in SimuCell.
|
Angular marker gradient |
Produce an angular dependence (gradient) of the marker level |
|
Cell density dependent marker |
Operation that sets the marker level in an object, based on the local cell density. |
|
Constant dependent marker level |
Marker is set to a constant level on an object, with this level being determined by distribution of another Marker/Object pair (e.g. cytoplasm intensity of Marker 1 is decided by the nuclear density of Marker 2) |
|
Constant marker level |
Constant marker level with no dependencies. Also, it will change from cell to cell. |
|
Distance to edge marker level |
Marker level at a pixel will depend on its distance to the edge of the object |
|
Distance to shape marker gradient |
Marker level at a pixel will depend on its distance to an object in the same cell |
|
Linear marker gradient |
Marker level will decrease/increase following a linear gradient |
|
Locally dependent marker level |
Level of the marker at a pixel depends of the level of another marker at the same pixel |
|
Micro environmental marker level |
Will make the cells close to each other having a similar level of marker intensity |
|
Perlin texture |
Adds noise like texture |
|
Turbulent texture |
Redistribution of the marker level among neighboring pixels to produce a turbulence effect. Works only on non-uniform marker level intensity |
|
Rescale Marker level |
Stretch out the marker level (for example to increase contrast) |
The operations marked blue are the ones that set the initial distribution while the others redistribute and refine this initial marker level distribution.
Subpopulation, object and marker definitions are needed for SimuCell to produce images. However, there are a number of other optional effects that can be added to make more realistic images:
Placement is used to determine how your cells will be distributed in an image (randomly, clustered and so on). Currently, SimuCell provides:
Overlap lets you define to what extent different cells can overlap, and how this should be measured (on the nucleus, cytoplasm etc).
Compositing allows you to change the way a marker is rendered when there is an overlap between two objects, both containing the marker. Currently, only one plugin exists (Default compositing)
These allow you simulate imaging effects from microscopy image acquisition at a whole image level. SimuCell currently provides:
Cell artifacts allow you to add effects (typically imaging/staining) on a cell by cell basis. SimuCell currently provides:
SimuCell requires MATLAB version ≥ 2011a to work.
This tutorial is a step by step guide to build a synthetic image containing a single subpopulation of cells. The cells contain only a nucleus and cytoplasm. They are “stained” with a nuclear marker, a membrane marker and a cytoplasmic marker whose intensity depends on the local cell density.
Open a MATLAB terminal and go to the SimuCell project folder and enter the following commands:
>cd simucell/src
>simucell
>simucellGUI
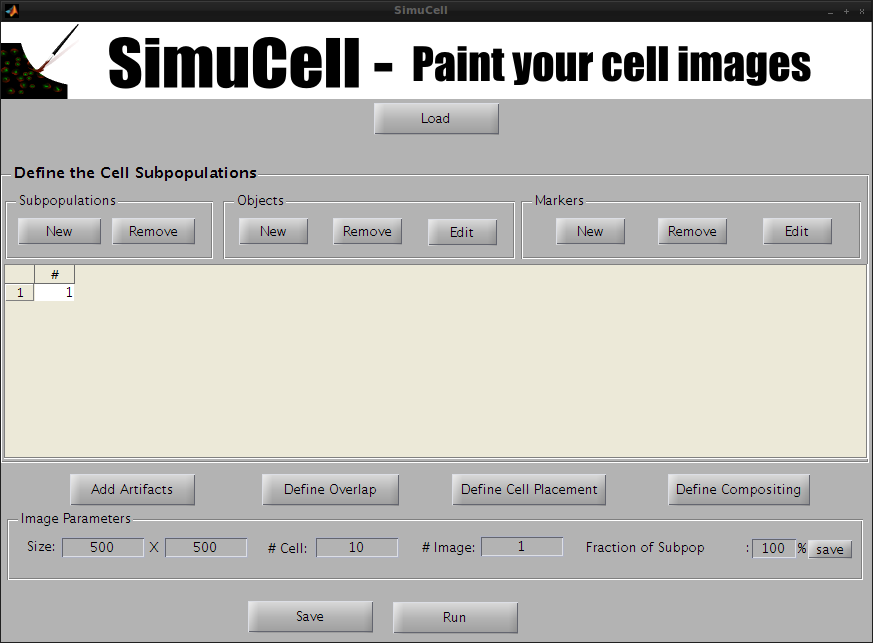
Figure 2- SimuCell Startup Screen: 1 empty subpopulation is present
The SimuCell interface starts with a subpopulation pre-declared (Subpopulation 1). If you want to work with more than one subpopulation, you add one by clicking on New in the Subpopulation subpanel.
In this example, we will use only one subpopulation.
We add objects to our subpopulation by clicking on the New button in the Objects subpanel.

Figure 3 - Create a new Object/Shape named Cyto
A new popup window will appear. Enter the name of the object (in our example, we will use Cyto) and press OK.
The Cyto object is now visible in the main window in the Subpopulation table.

Figure 4 - Cyto Object/Shape is now visible in the Main table interface
Let’s create another object. Click on the button New of the subpanel Objects to add a new object/shape.
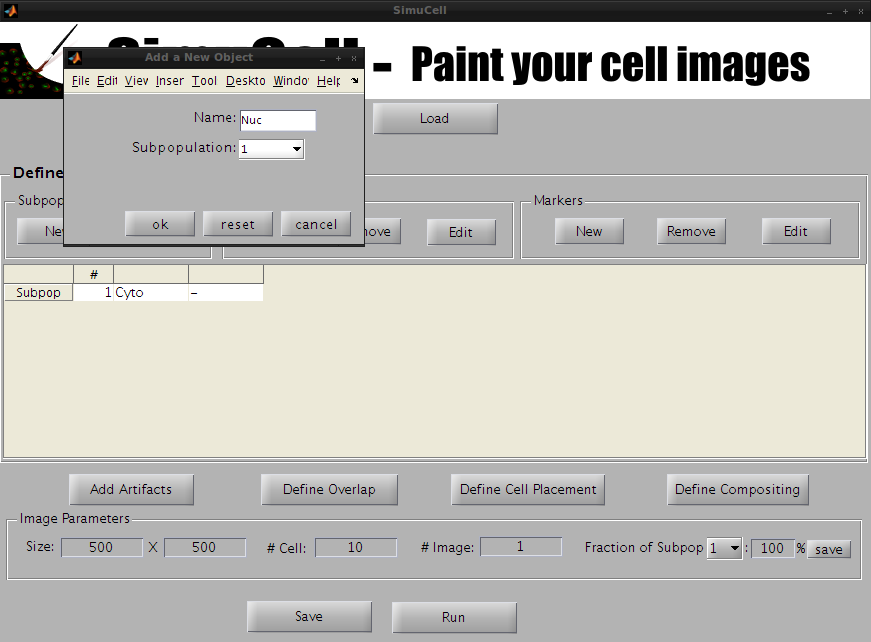
Figure 5 - Create a new Object/Shape named Nuc
A new popup window appears. Enter the name of the object (in our example, we will use Nuc) and press OK.
The Nuc object is now visible in the main window in the Subpopulation table.
Once all the objects types have been created, they can be defined in detail by choosing appropriate models/parameters to render their shapes.

Figure 6 - Select the Object/Shape Nuc to define it in more detail
First, select the object Nuc and click Edit in the Objects subpanel.
A new window will pop up allowing you to define the Object/Shape Nuc.
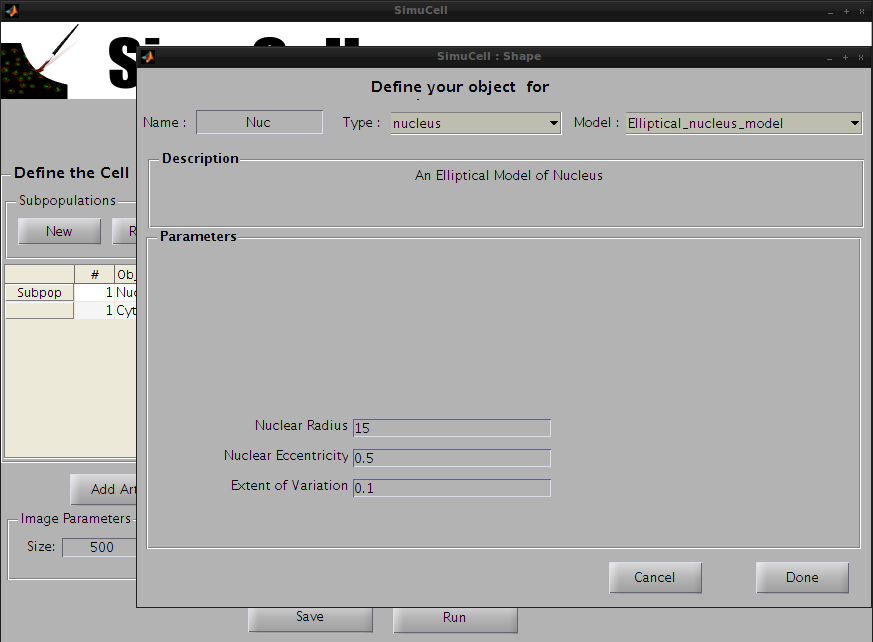
Figure 7 - Select a Type, Model and set the parameters for the Object/Shape Nuc
Choose the type nucleus and the model Elliptical_nucleus_model and use the following parameters:
Then press Done.
A warning dialog will popup stating that the two objects/shapes are not connected to each other. We are going to fix this by next by defining the object/shape Cyto to be dependent of the object/shape Nuc. So for now, press Proceed Anyway! And let’s define the other object/shape.
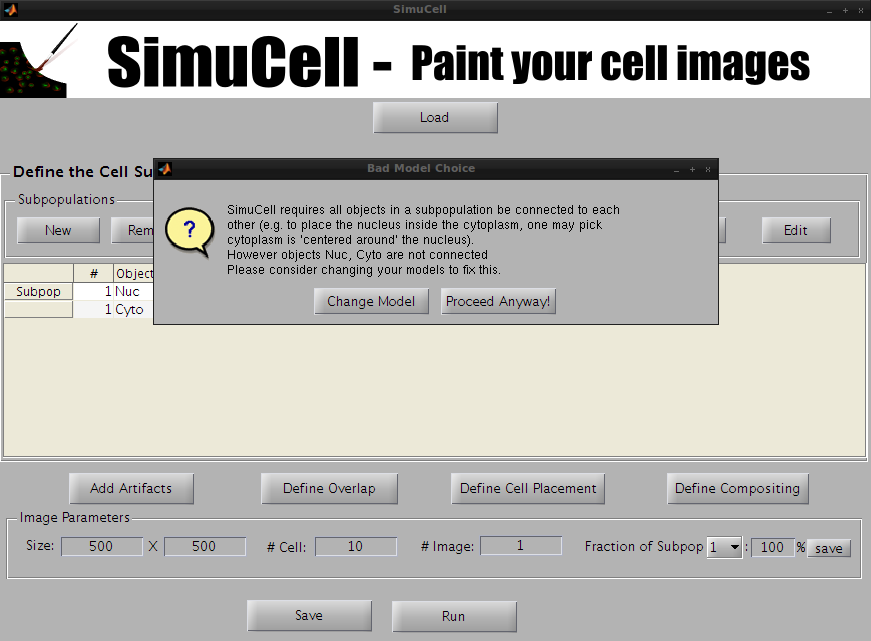
Figure 8 - When the Objects/Shape are not connected to each other, a warning dialog will pop up to inform you that Object/Shape should be inter-connected to each other (e.g., Cytoplasm should be centered around the Nucleus).
Select the object Cyto and click Edit in the Objects subpanel.
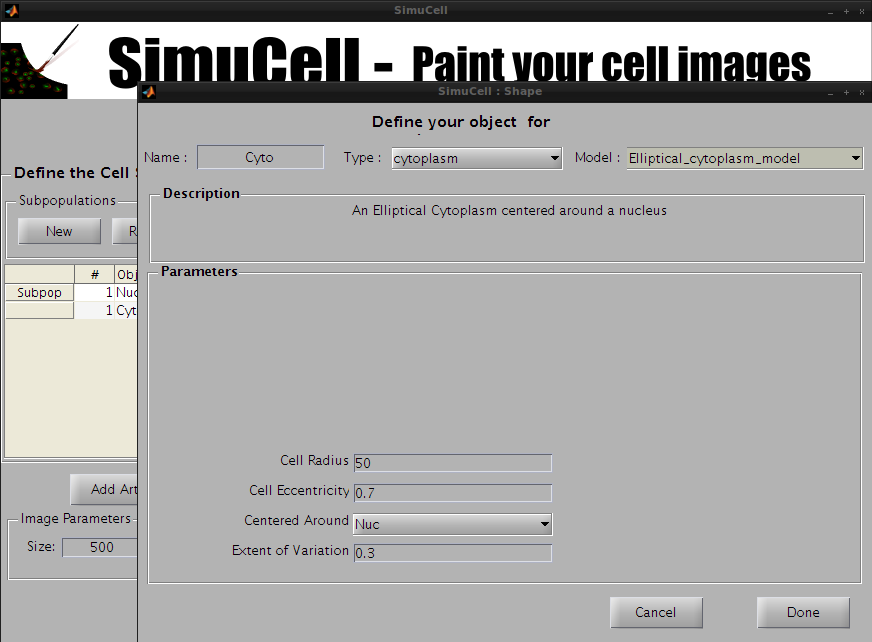
Figure 9 - Select a Type, Model and set the parameters for the Object/Shape Cyto
Choose the type cytoplasm and the model Elliptical_cytoplasm_model and use the following parameters:
Then press Done.
Congratulations, you have just finished defining the objects/shapes used in this tutorial.
Next, you will create the markers used to “stain” the cells in our synthetic images.
Select an entry in the Subpopulation table and click on the New button in the Markers subpanel.
A new pop-up window will appear. Enter the name of the marker (in our example, we will use DAPI), select the marker color (in our example, we will use Blue) and press OK.
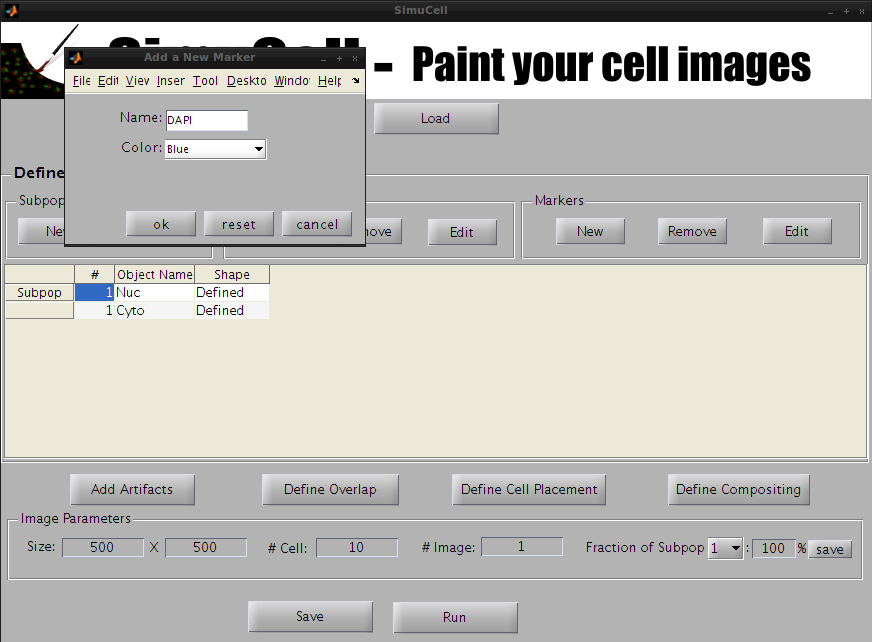
Figure 10 - Create a new marker named DAPI and set it to be Blue in color
The subpopulation table should now display a new column named DAPI.
Repeat the previous step to create the markers MembMarker in Red and CytoMarker in Green.
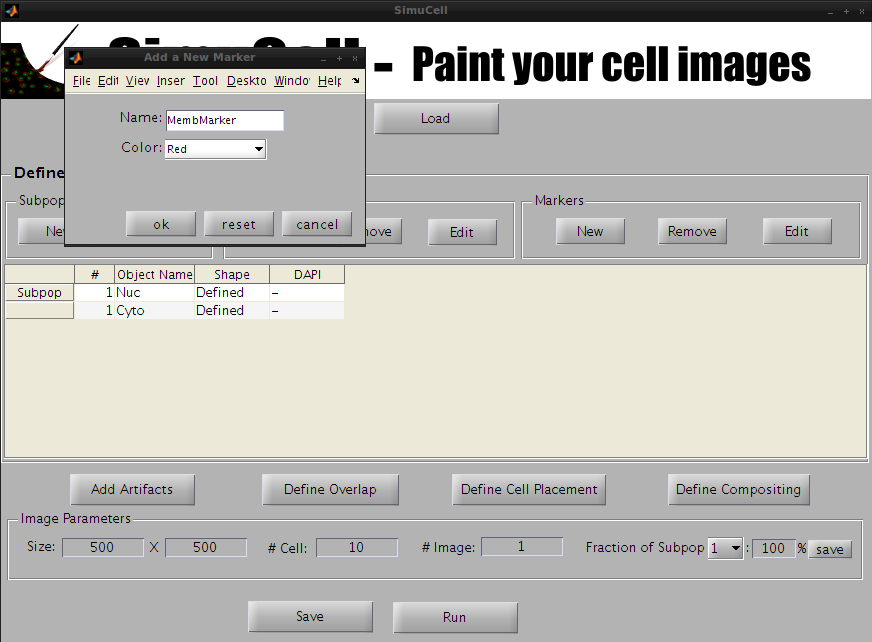
Figure 11 - Create a new marker named MembMarker (Red)

Figure 12 - Create a new marker named CytoMarker (Green)
Once the markers have been created, you will have to define them for each object/shape by defining a sequence of operation(s). These operations will determine how SimuCell renders the markers within the selected object/shape.
Start by selecting which object/marker pair you would like to define.
In the subpopulation table, select the marker DAPI for the object/shape Nuc.

Figure 12 - Select the Marker DAPI for the Shape/Object Nuc
Then click Edit in the Markers subpanel. A new window to define the marker will appear.
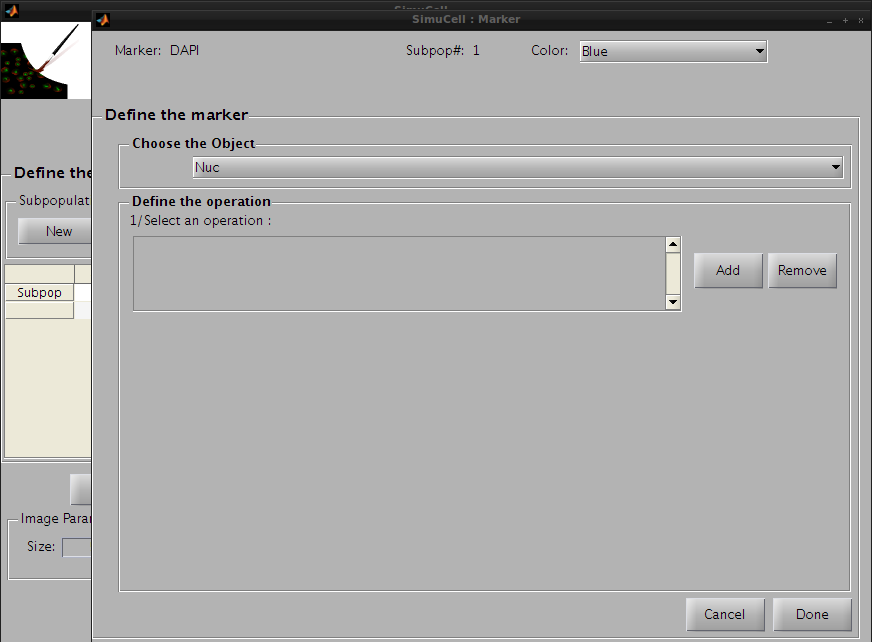
Figure 13 - Define the pair DAPI/Nuc by adding some operations
Click on Add in the Define Operation subpanel to add an operation. The default operation, Constant_marker_level_operation, will appear in the operation list. We will use this default operation with the following parameters:

Figure 14 - Define the first operation for the pair DAPI/Nuc
Then click on the Save button to save this operation and press the Add button to add a new one. Click on the operation list and select Perlin_Texture. This operation adds a noise-like texture, and will make DAPI look more realistic on Nuc.

Figure 15 – Select the cell corresponding to the Marker/Object pair DAPI/Nuc
We will use the following parameters:
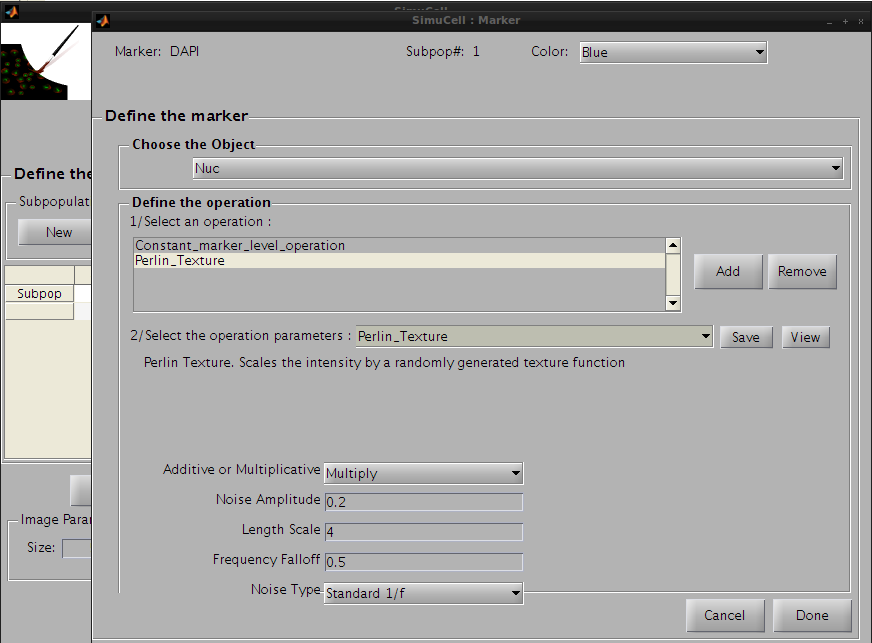
Figure 16 - Set the Perlin Texture operation parameters for the pair DAPI/Nuc
Press the Save button to save this operation. The operation’s name on the operation list will be changed from Constant_marker_level_operation to Perlin_Texture and the parameters for this operation will be saved. Then press Done to go back to the main interface.
You can now see that the marker DAPI for the object/shape Nuc has been defined.

Figure 17 - The Marker DAPI for the Object/Shape Nuc has been defined
In the subpopulation table, select the marker MembMarker for the object/shape Cyto.
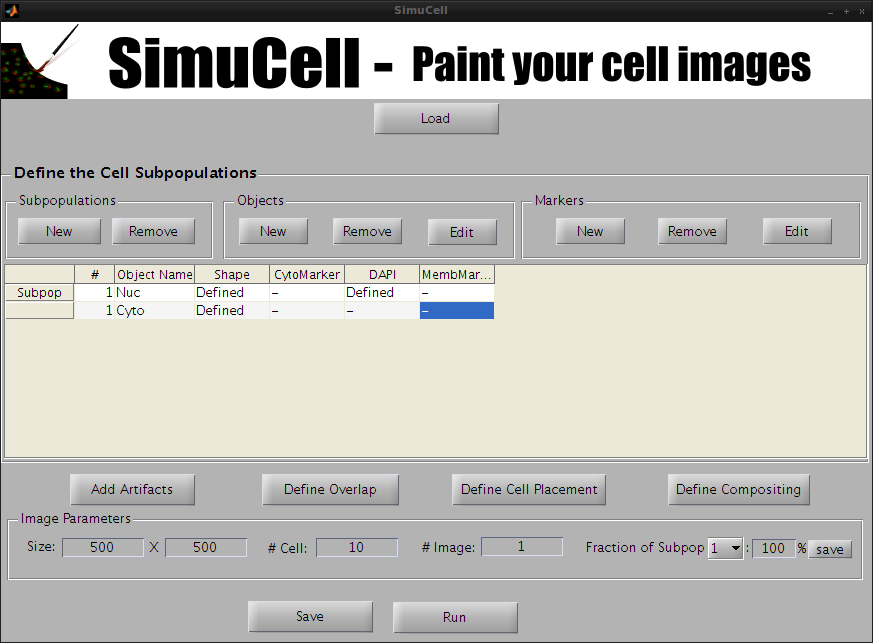
Figure 18 - Select the Marker MembMarker for the Shape/Object Cyto
Then click Edit of the subpanel Markers. The window to define the marker will show up.

Figure 19 - Define the pair MembMarker/Cyto by adding operations
Click on Add in the subpanel Define Operation to add an operation. The default operation Constant_marker_level_operation will appear in the operation list. We will use first this operation and set the following parameters:
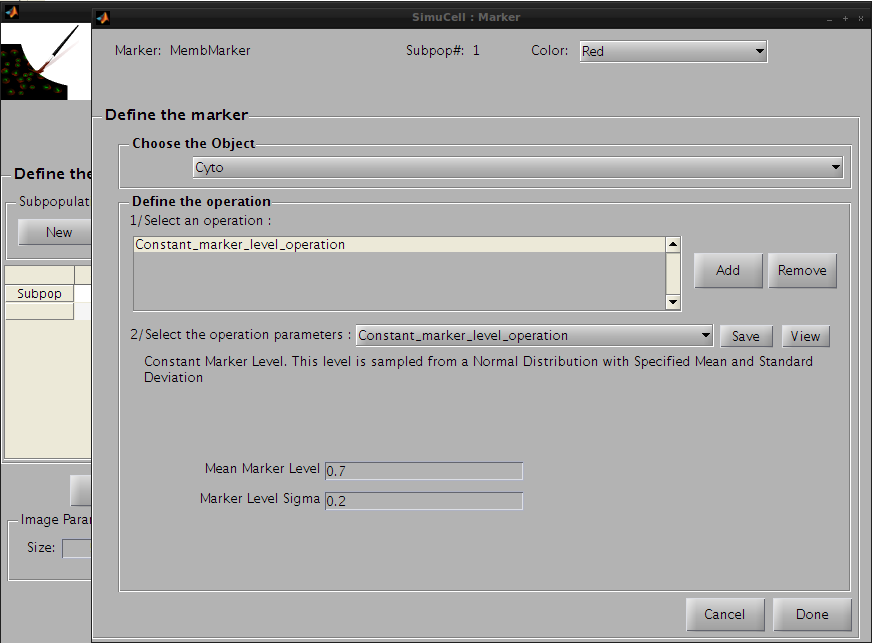
Figure 20- Define the first operation for the pair MembMarker/Cyto
Then click on the save button to save this operation and press the add button to add a new one. Click on the operation list and select Distance_to_edge_marker_gradient. This will be used to concentrate the high intensity regions of the marker close to the edge so that MembMarker will appear localized to the membrane

Figure 21 - Add the second operation Distance to edge marker gradient and set the parameters
We will use the following parameters:
Press the Save button to save this last operation

Figure 22-Save the second operation
and then the button Done to go back to the main interface. You can see that the marker MembMarker for the object/shape Cyto has been defined.
In the subpopulation table, select the marker CytoMarker for the object/shape Cyto.

Figure 23 - Select the marker CytoMarker for the Object/Shape Cyto
Then click Edit of the subpanel Markers. The window to define the marker will appear.

Figure 24 - Define the Marker CytoMarker for the Object/Shape Cyto
Click on Add in the subpanel Define Operation to add an operation. The default operation Constant_marker_level_operation will appear in the operation list. We won’t use this one but instead the operation Cell_Density_Dependant_Marker_Level to produce a cell density dependent marker intensity.
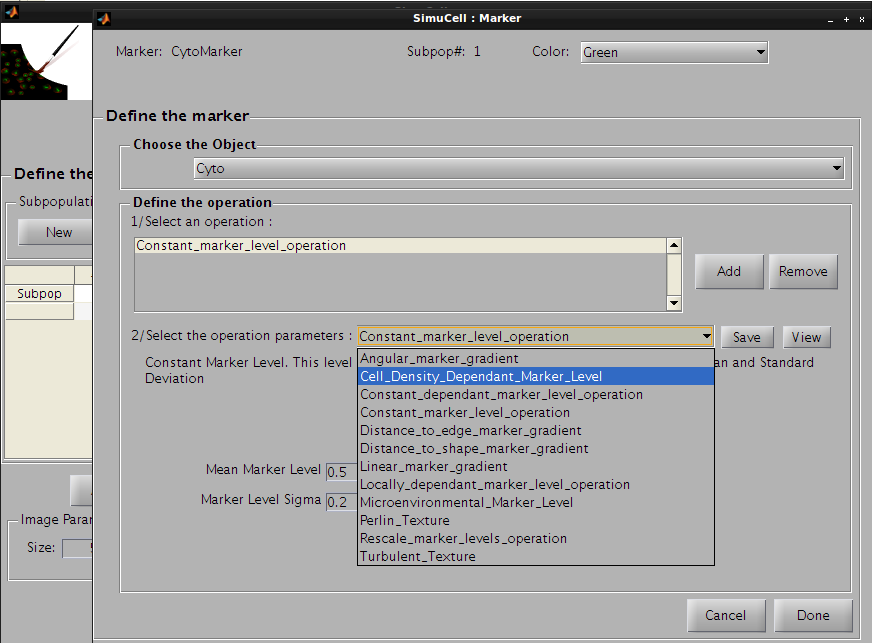
Figure 25 - Use Cell density dependant marker level as first operation of the pair CytoMarker/Cyto
The following parameters will be used:

Figure 26- Define parameters for the first operation of the pair CytoMarker/Cyto
Then click on the save button to save this operation and press the add button to add a new one. Click on the operation list and select Distance_to_shape_marker_gradient, so the CytoMarker marker for Cyto object/shape will appear with a light gradient from the nucleus.
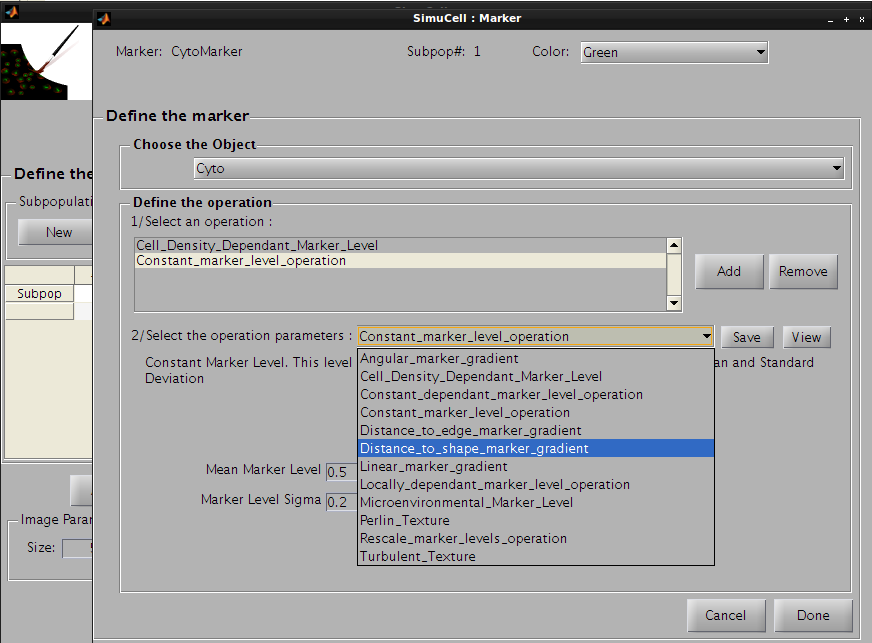
Figure 27 - Use Distance to shape marker gradient for the second operation for the pair CytoMarker/Cyto
The following parameters will be used:

Figure 28 - Define parameters for the second operation of the pair CytoMarker/Cyto
Then click on the Save button to save this operation and press the Add button to add the last operation. Click on the operation list and select Perlin_Texture, so the CytoMarker marker for Cyto object/shape will look more realistic.
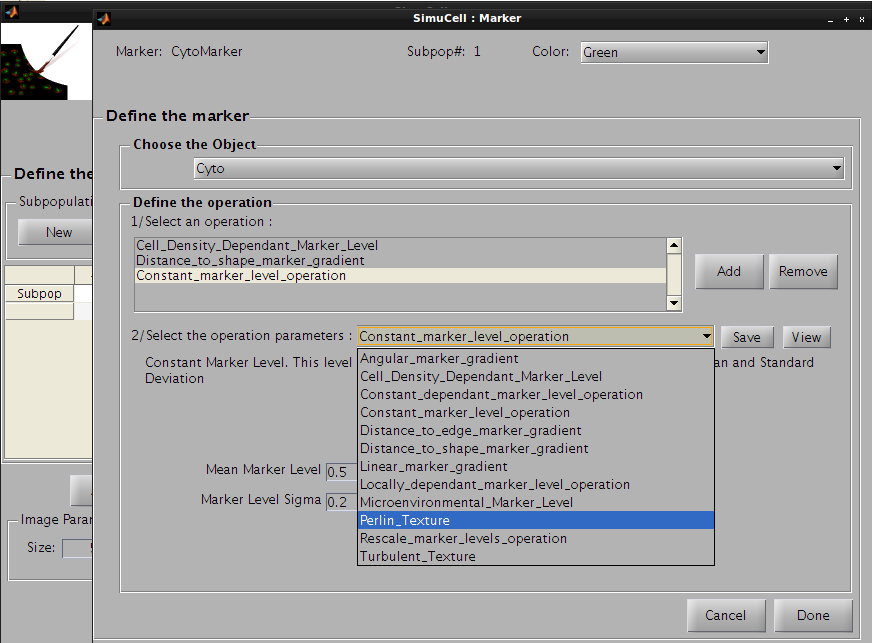
Figure 29 - Use Perlin Texture for the last operation for the pair CytoMarker/Cyto
The following parameters will be used:
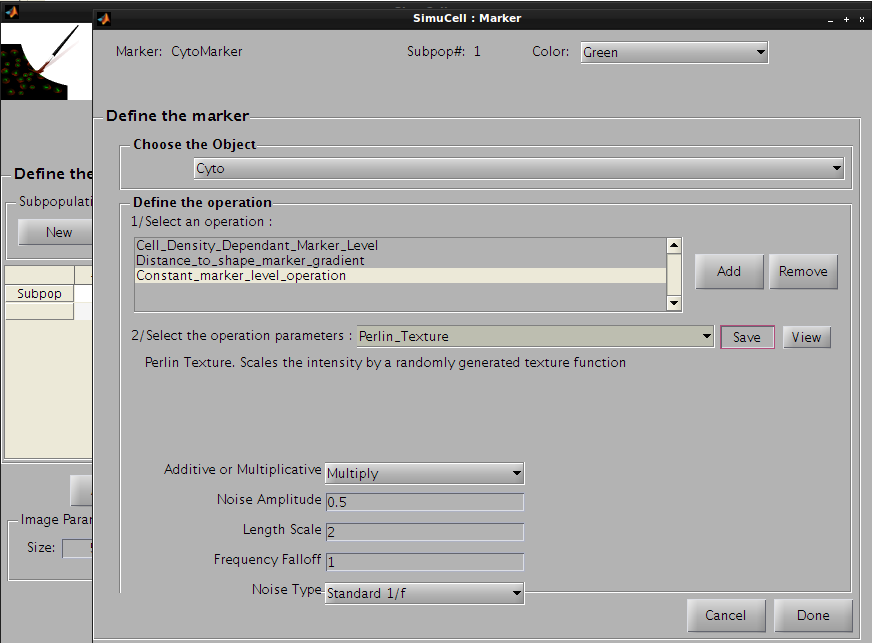
Figure 30 - Define parameters for the last operation of the pair CytoMarker/Cyto
Press the Save button to save this operation. The operation’s name on the operation list will be changed from Constant_marker_level_operation to Perlin_Texture and the parameters for this operation will be saved.

Figure 31 - Save the last operation
Then press Done to go back to the main interface. You can see that the marker MembMarker for the object/shape Cyto has been defined.
We are now almost done with this tutorial. You should first save your work by clicking on the Save on the main interface.
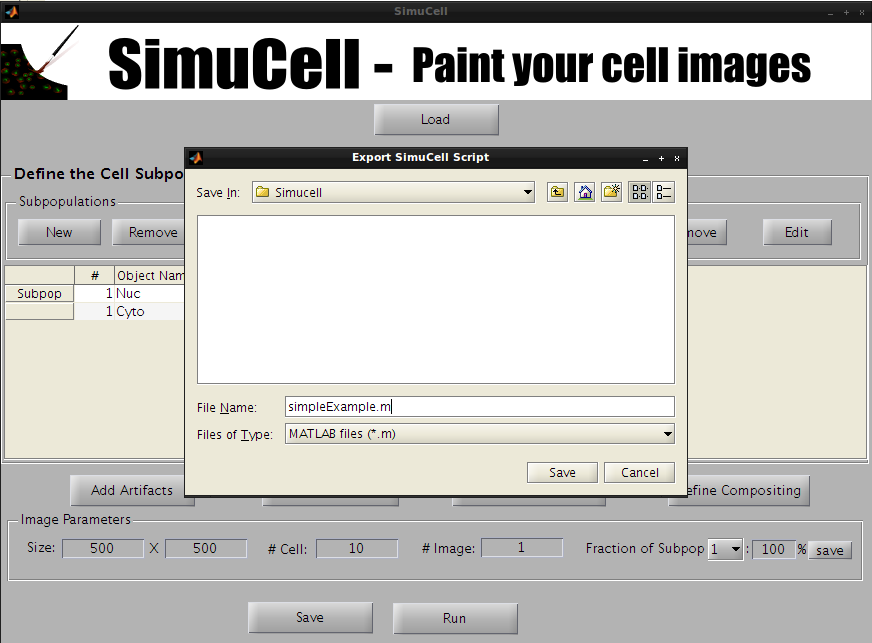
Figure 32- Save the SimuCell model
Select a directory to save the files and enter a file name (don’t forget to add the extension .m at this end), like simpleExample.m.
Two files will be saved, one .m which contains a MATLAB script that you could use to generate your synthetic images, one .mat that contain the SimuCell MATLAB structure that you can load from the SimuCell interface.
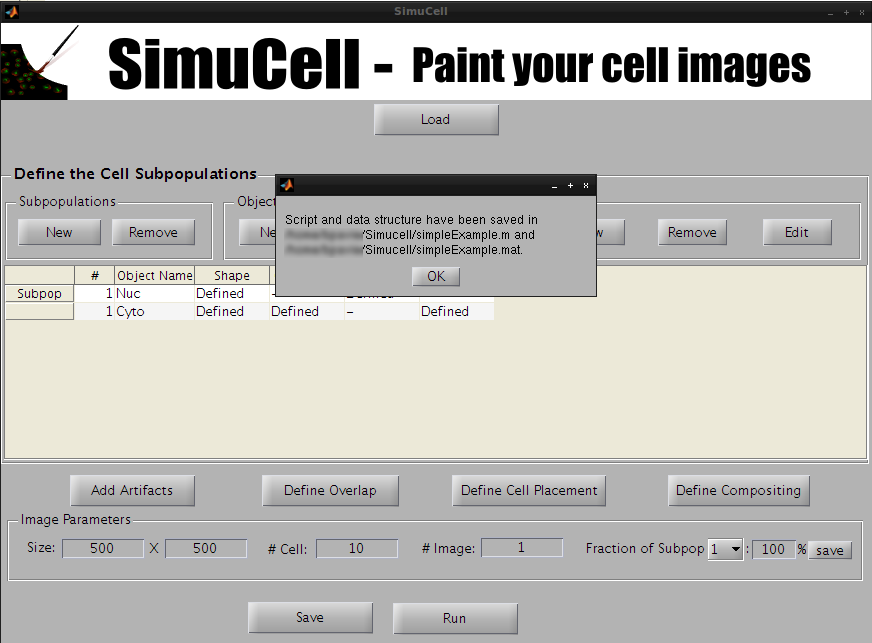
Figure 33 - SimuCell data file and script file save successfully!
Press the Run button to run SimuCell and generate the image.

Figure 34 – Press the Run button to run your SimuCell model
A waiting bar will popup and after a pair of second/minute you should see your images.
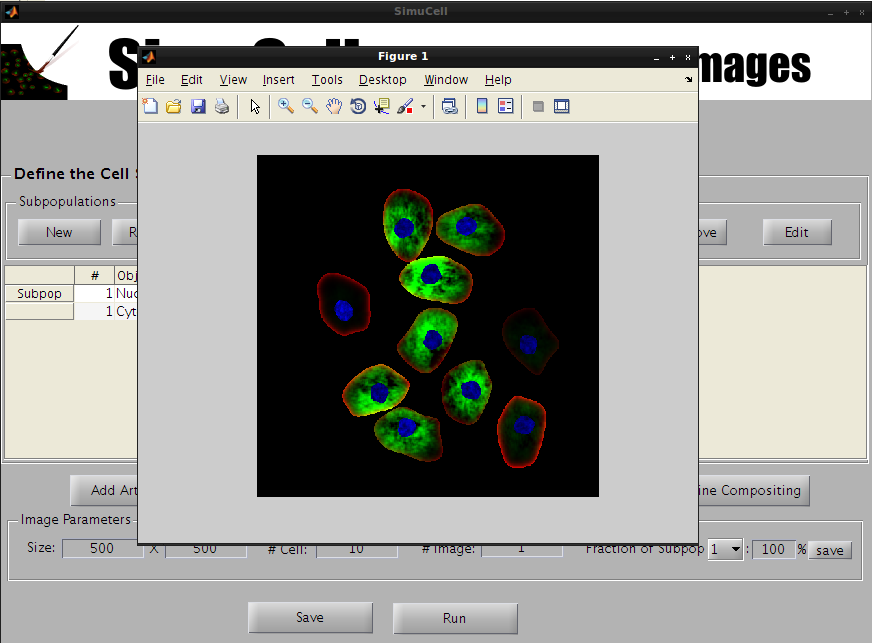
Figure 35 - Your first cell images through SimuCell
To really see what’s going on, you can open the .m file and review the MATLAB script to see how SimuCell operate.
For this tutorial, we didn’t discuss other parameters like placement, cell and images artifact, overlapping and compositing. Since we didn’t define them, SimuCell will use automatically default settings for those parameters.
Another way to generate synthetic images using SimuCell is to create and run scripts.
Some documented script examples are located in simucell/saved_data
|
simucellTestSimple.m |
The simple SimuCell example described in the Basic SimuCell tutorial |
|
polarized.m |
A more complex script producing two subpopulation of polarized cells |
|
microenv.m |
A script example to show how to add micro-environment effect. |
To run these scripts, use simucell.m (located in simucell/scr) that we used previously in the tutorial.
>cd simucell/src
>result=simucell('simucellTestSimple')
Where 'simucellTestSimple' is the script name.
This will execute the simucellTestSimple.m script, plot one image and return the result variable:
> result =
subpopulation_numbers_of_cells: [10x1 double]
RGB_image: [500x500x3 double]
mask_of_object_by_cell: [1x10 struct]
marker_on_object_by_cell: [1x10 struct]
channel_images: [1x1 struct]
Here is a quick description of the output variable:
Additional parameters may be used (see example below):
>simucell('simucellTestSimple', 'save_results', 2)
|
image |
Will additionally plot the first RGB image result. If the number of images is bigger than one, it will also offer to save these images. |
|
save_results |
Will offer to save the result into a *.mat file. |
|
save_params |
This option won’t run the SimuCell engine and will just save the script parameters into a .mat file that can be loaded into the GUI interface using the load button. |